
Interactive calculators, dashboards and visual aids
Built with advanced analytics and business intelligence. Adjust values with sliders to calculate the effectiveness of maintenance planning, reduce downtime costs and improve equipment performance and operational efficiency.
- 4
- Maintenance calculators
- 2
- Interactive dashboards
- 6
- Tools, free to try
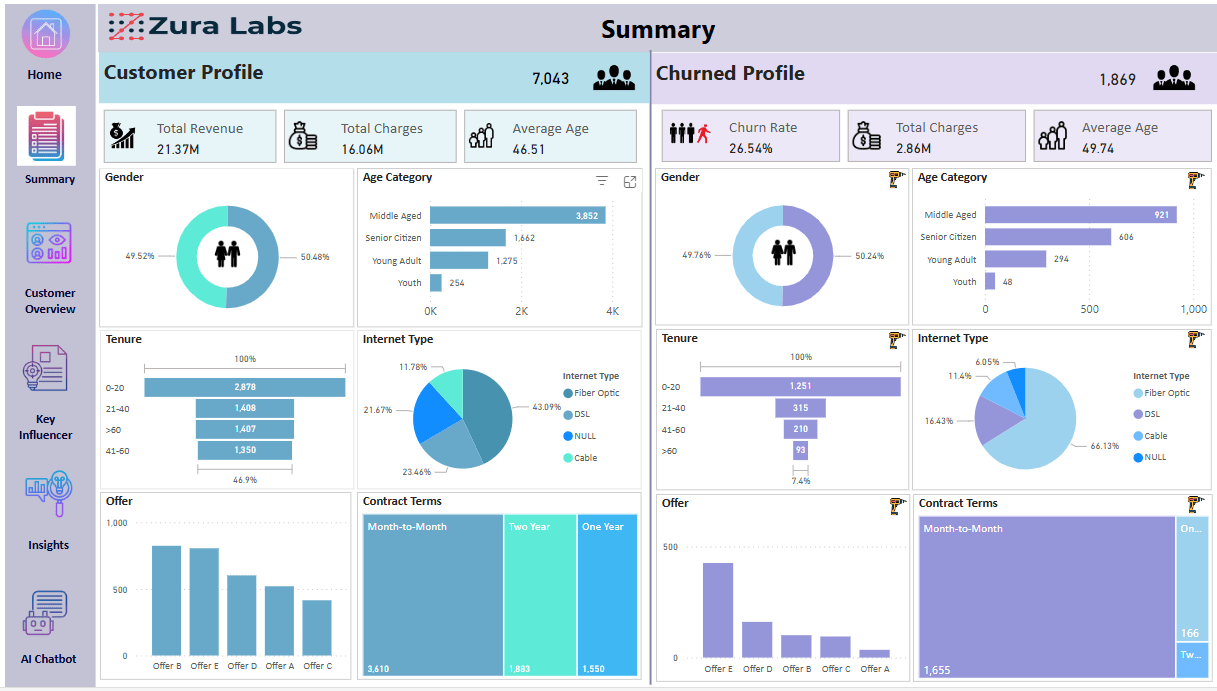 Featured dashboard
Keeping your telecom customers happy
Key influencers of retained and churned customers, plus a conversational assistant that answers management questions with supporting numbers.
Try it out
-
Step 01
Pick a tool
Choose a calculator or dashboard that matches the decision in front of you.
-
Step 02
Adjust the sliders
Enter your own equipment, cost and production values. No setup needed.
-
Step 03
See the impact
Results update instantly, so you can compare scenarios and plan with confidence.
Maintenance calculators
Quantify your maintenance decisions
RUL calculator
Estimate the remaining useful life of your equipment, a great step towards optimizing operating efficiency by scheduling maintenance before breakdowns.
Try it out MTBFMTBF calculator
Measure the mean time between failures of equipment or a component, predicting the average time it operates before encountering a failure.
Try it out MC/DCMC vs DC calculator
Compare the cost of repair or maintenance against the potential cost of downtime if the equipment fails, and decide between proactive maintenance and risking unplanned downtime.
Try it out OEEOEE calculator
Calculate overall equipment effectiveness to assess operational effectiveness and identify areas of improvement to maximize equipment performance.
Try it outDashboards
Analytics you can explore
Keeping your telecom customers happy
Understand why customers leave. The model features key influencers of retained and churned customers, insights into customer data by dimension, and a conversational assistant that answers management questions with supporting numbers.
Try it outStay informed worldwide
Dive into global happenings with an interactive Power BI dashboard. Track current events, compare trends and filter by region for insights at your fingertips.
Try it outNeed visual aids like these?
We build interactive calculators and dashboards tailored to your data. Reach out and tell us what you need.